
Istanbul Home Prices 2026: The Market Analysis
1 September 2026
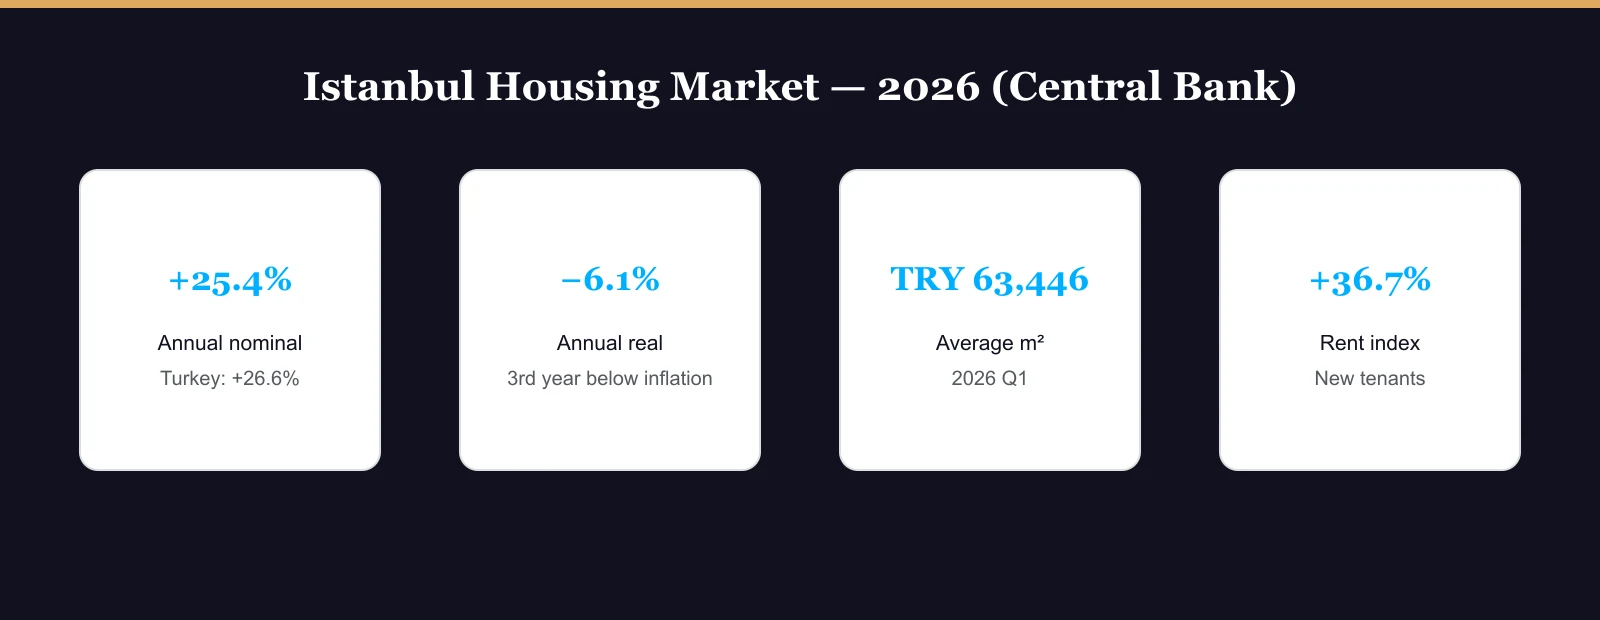
Istanbul's 2026 housing story in one sentence: nominal growth continues, real prices decline. Per the central bank's House Price Index, Istanbul prices rose 25.4% year on year — but inflation-adjusted, that is a 6.1% real decline. That gap is 2026's most important number for buyers and sellers alike. (This is a price analysis; for the district-yield strategy see our investment guide.)
Istanbul in Five Indicators (Central Bank, 2026)
| Indicator | Value | Read |
|---|---|---|
| Annual nominal change | +25.4% | Slightly under the national average (26.6%) |
| Annual real change | −6.1% | A third consecutive year below inflation |
| Monthly change (May) | +2.1% | Moderate momentum, no crash |
| Average price per m² | TRY 63,446 (2026Q1) | Was 3,850 in 2015 — ~16× nominal in 11 years |
| New-tenant rent index | +36.7% | Rents outrunning sale prices |
What Does the Real Decline Mean?
- For buyers: a market getting cheaper against inflation — a meaningful entry window versus the 2021–22 peak, especially for FX earners.
- For sellers: the "my price is rising" illusion: the TL tag grows while its purchasing-power value erodes; the cost of waiting accrues on the real side.
- For the market: the rent index (36.7%) overtaking the price index (25.4%) is a classic bottom-forming signal — as rent-to-price rises, investor demand returns.
Segment Divergence: There Is No Single Istanbul
- The dollar-based prestige belt (Bosphorus line, Nişantaşı-Levent, Kadıköy seafront): quoted in FX; relatively immune to TL swings, least touched by the real decline.
- The mid-belt TL market (the Beylikdüzü-Esenyurt axis, the Anatolian fringe): the centre of the real decline; abundant supply widens negotiating room.
- Metro/regeneration corridors (the Kağıthane, Eyüpsultan line): exception pockets running above the index — infrastructure news prices in instantly.
- For current district-level price levels with live inventory, see our Istanbul home prices page.
Worked Analysis: One Flat From the 2021 Peak to Today
A prestige-belt flat priced TRY 5M (≈ $580k) in 2021: today the TL tag reads ~13–14M (nominal +170%) — yet in dollars it is ~$330–360k, i.e. 35–40% cheaper than the peak for an FX-thinking buyer. Meanwhile its rent held up relatively well in dollars: that is the mechanism making Istanbul's yield percentages attractive again in 2026. (The yield strategy is the other article's subject.)

The 2026–27 Outlook: Three Scenarios
| Scenario | Condition | Price effect |
|---|---|---|
| Base | Disinflation continues, rates ease gradually | Nominal 20–30%; real flat/−, real turn late in the year |
| Strong | Mortgage costs fall decisively | Pent-up demand releases; the real upturn starts early (the rent signal supports it) |
| Weak | Inflation stays sticky | The real decline stretches to a fourth year; the FX-based layer widens the divergence |
The common denominator: in all three, the protected side buys with FX and holds rent-producing assets; the most fragile position is TL cash waiting on the sidelines.
Practical Consequences for Buyers and Sellers
- If you are buying: anchor negotiation to the dollar value and comparable rent multiples, not the TL tag; the real decline works for you.
- If you are selling: "it rises if I wait" is nominally true, really false — count your holding cost (opportunity cost + fees/tax).
- If you are a landlord: the rent index overtook prices; comparable-rent research at renewal is worth more than ever.
- If you earn in FX: tilting segment choice to the prestige belt converts the currency+price double advantage into a durable asset.
Three Sentences to Take Away
- Istanbul in 2026 is a market getting dearer nominally and cheaper in real terms — read the index, not the headlines.
- Rents overtaking prices says the cycle is maturing in the buyer's favour.
- For dollar-based thinkers the window is open; segment choice (prestige vs mid-belt) will decide the outcome more than anything.
Talk to our advisors to translate the market data into your own budget and segment choice.
Frequently Asked Questions
Did Istanbul prices rise or fall in 2026?
Both: +25.4% nominal per the central-bank index, but −6.1% in real terms after inflation. The TL tag grows while its purchasing-power value falls.
What is the average price per m² in Istanbul?
TRY 63,446/m² in Q1 2026 — Turkey's highest. It was 3,850 in 2015; roughly 16× nominal in 11 years.
Are rents rising faster than prices?
Yes: the new-tenant rent index (+36.7%) overtook the price index (+25.4%) — a signal that rent-to-price is improving and the cycle is maturing in buyers' favour.
What does the real decline mean for buyers?
A market getting cheaper against inflation: for FX earners it means a dollar-based discount of up to 35–40% versus the 2021–22 peak.
Which segment resisted the real decline most?
The FX-quoted prestige belt (Bosphorus line, Nişantaşı-Levent, Kadıköy seafront). The mid-belt TL market is the decline's centre.
What is the outlook into 2027?
Base case: 20–30% nominal growth with a real turn late in the year. A decisive fall in mortgage costs could pull the real upturn forward.
Buy now or wait?
Buying with FX and holding rent-producing assets is protected in every scenario; waiting in TL cash is the most fragile position. Personalise by segment and budget.
Where is the district-by-district yield strategy?
Deliberately outside this piece: district yields, payback and investor-area matching live in our Istanbul investment guide.