
The Best Areas to Invest in London (2026)
11 August 2026
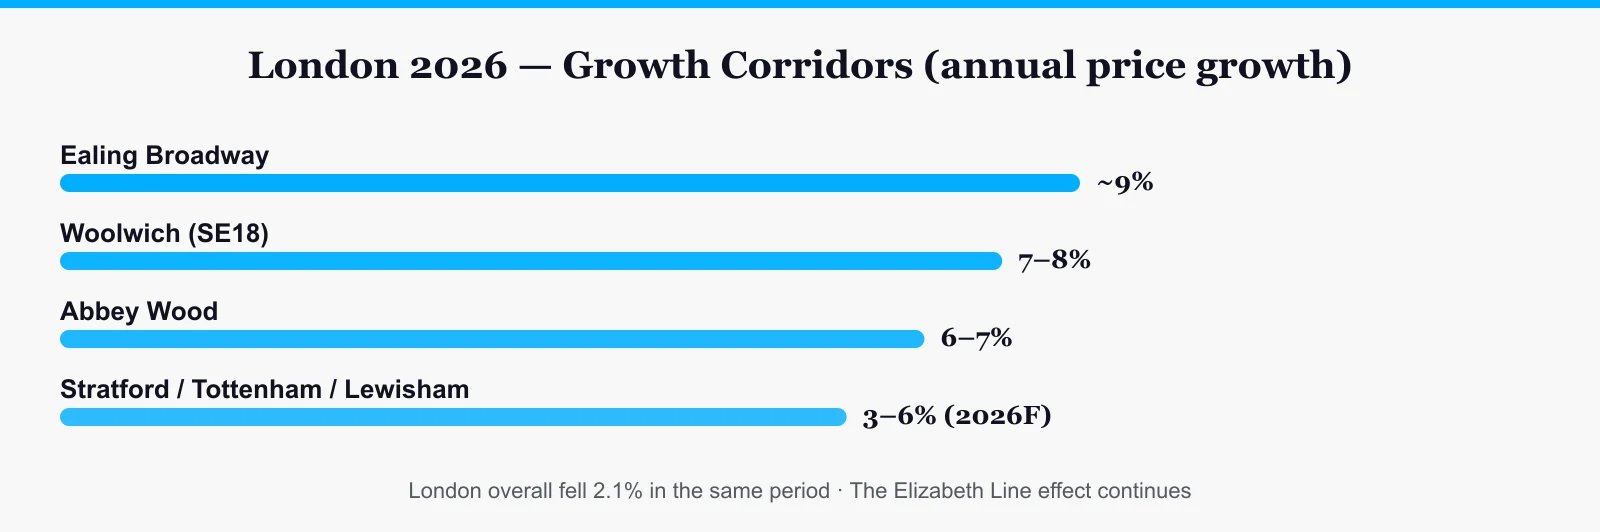
The 2026 answer to "where to buy in London" hides in two words: transport and regeneration. While citywide average prices slipped slightly over the last year (−2.1%), areas on the right corridors kept growing at 6–9%. This article focuses on area selection; for yield methodology, taxes and the purchase math see our buy-to-let guide.
The Growth Champions of 2026
| Area | Signal | Investment thesis |
|---|---|---|
| Woolwich (SE18) | +91% around the Elizabeth Line station since confirmation; ~7–8% a year | Mid-regeneration; rents +41% in 5 years — catch-up still running |
| Abbey Wood | ~6–7% a year | One stop beyond Woolwich, lower entry |
| Ealing Broadway | ~9% a year | The western line's mature but still-growing node |
| Southall | <15 min to Bond Street; rent growth touched 12% | 6%+ yields — where airport and central demand intersect |
| Stratford / Tottenham / Lewisham | 3–6% expected in 2026 | The eastern leg of the transport + regeneration combo |
The anchor comparison: over the same period London as a whole declined — picking the right area means buying the corridor's performance, not the city average.
The Elizabeth Line Effect: Why It Isn't Over
- The price effect began at station confirmation, but full usage habits are still bedding in — outer-station catch-up continues.
- The rule: stations that got minutes-close to the centre while still priced as outer London (Southall, Abbey Wood, Woolwich) offer the most efficient equation.
- The same logic applies to Overground upgrades and DLR extension agendas — price follows the line news.
For Yield Hunters: The Outer High-Yield Belt
The percentage-focused shortlist for 2026: Harrow, Wembley, Southall, Woolwich — the 6%+ gross band. Croydon is worth watching too: a relatively affordable ~£395k average with rents up 3.7% a year (London average: 2.0%).
For Appreciation Hunters: The Regeneration Zones
- Nine Elms / Battersea: one of Europe's largest regenerations; the Northern Line extension made it a true Zone 1 neighbourhood. Lower percentage, higher asset quality and rental depth.
- Stratford: Olympic legacy plus a campus-driven east; strong corporate tenant pool.
- Lewisham / Tottenham: "next ring" candidates on planning approvals and new supply.
The Area Report Card: Four Candidates in One Table
| Area | Entry signal | Tenant base | Right profile |
|---|---|---|---|
| Woolwich | Still outer-London priced, central access | Young professionals + Elizabeth Line commuters | Growth + yield balance |
| Southall | Airport 10 min / Bond St 15 min | Aviation + central workers | Pure yield (6%+) |
| Croydon | ~£395k average; rent momentum (+3.7%) | Family + young professional mix | Budget entry, patient growth |
| Nine Elms | Zone 1 status, tower stock | Corporate, embassy/finance | Asset quality + easy exit |
Worked Comparison: One Budget, Two Strategies
With £400k: (a) a two-bed in Woolwich — ~6.5% gross, strong rent momentum, the centre of the five-year appreciation thesis; (b) a studio/one-bed on the Nine Elms fringe — ~4.5% gross, but a Zone 1 asset with resale liquidity. Prioritise cash flow → (a); prioritise asset quality and easy exit → (b). Our 10 London listings span both strategies (from $575k entries to prime assets).
Timing: Why 2026 Is a Selective Window
Corridors growing while the London average slips is a classic divergence market: index headlines scare buyers off while competition thins in the right areas. Every easing on the rate path revives outer-London demand first — the corridor buyer's advantage window is this gap before mortgage costs fall decisively. The rule: negotiate with the city headline, choose with the corridor data.
5 Field Rules for Area Selection
- Keep the real walk to the station (on foot, not on the map) under 10 minutes.
- In regeneration zones buy the completed phase; don't pay tomorrow's phase price today.
- Check the borough's licensing regime — some require additional landlord licences.
- Compare service charge quotes on new builds; it is the silent yield-eater.
- Verify tenant demand per station: occupancy can differ surprisingly between two stations in one borough.
Browse current options by target area in our London listings, or talk to our advisors to match area and strategy.
Frequently Asked Questions
Which London areas are appreciating fastest in 2026?
Woolwich, Abbey Wood, Stratford, Tottenham and Lewisham lead with 3–6% expected growth; Ealing (~9%) and Woolwich (~7–8%) are the recent champions.
Isn't the Elizabeth Line effect over?
No. Station-area catch-up continues; the +91% effect around Woolwich since confirmation has not yet completed at the outer stations.
Which areas for high rental yields?
Harrow, Wembley, Southall and Woolwich sit in the 6%+ gross band; Southall's rent growth touched 12%.
Does Nine Elms make sense?
Lower percentage (4–5%) but a regeneration zone that earned Zone 1 status via the Northern Line extension — suits appreciation/exit-focused profiles with its asset quality and liquidity.
Is Croydon still an opportunity?
At ~£395k average it remains one of London's affordable major centres, with rents up 3.7% a year. The growth story rides on transport and town-centre renewal — be selective.
Is buying an early phase in a regeneration zone an advantage?
It can be cheaper but carries delivery and surroundings risk; as a rule buy the completed phase and don't pay tomorrow's premium today.
What is the most common area-selection mistake?
Trusting map distance to the station. Real walking time, station-level tenant demand and the borough's licensing regime must be verified in the field.
How do I run the yield math for these areas?
The full methodology — gross-to-net, SDLT surcharges and NRL taxation — is covered step by step in our buy-to-let guide.